Python Diagrams
Or how to create infrastructure diagrams as code
Diagrams as code
Features of the Diagrams Python Tool
Supports a Variety of Diagram Types
- Major cloud providers (GCP, AWS, Azure, Alibaba, etc)
- Kubernetes workloads
- OpenStack
- Programming flowcharts and languages
- Generic solutions
- SaaS solutions
- And a big etcetera…
Customizable and Flexible
- Can combine multiple diagram types
- Can create functions to autogenerate diagrams
- Anything you can do with Python code
Easy to Use and Learn
- Simple and intuitive syntax
- Helpful documentation and examples
- Did I mention it’s written in Python?
Integrates Well with Other Tools
- Can be used within functions on different scripts
- Can be used as a web service
- Can be called from the command line
Advantages of Using the Diagrams Python Tool
Define as code, not as a drawing
As engineers, we are prone to not be very savvy about design tools and having to learn one just to create a simple infrastructure diagram for documentation can be taxing and time consuming.
Code can be commited
Most likely you’re already using some sort of version control system (git, svn, mercurial, etc) and you would like to keep using it for eveything else, commiting diagrams in this way is as simple as adding new python files to your project.
Can consume data to create diagrams
You can easily plug this into any other python scripts you may have to easily and automatically create architecture diagrams that change with the actual architecture.
How to Use the Diagrams Python Tool
Install the package using your favorite package manager
# using pip (pip3)
pip install diagrams

# using pipenv
pipenv install diagrams

# using poetry
poetry add diagrams
Start writing your python code…
# filename = diagrams.py
from diagrams import Diagram
from diagrams.aws.compute import EC2
from diagrams.aws.database import RDS
from diagrams.aws.network import ELB

with Diagram("Web Service", show=False):
    ELB("lb") >> EC2("web") >> RDS("userdb")
Run the script
python diagrams.py
Basic example
from diagrams import Diagram
from diagrams.aws.compute import EC2
from diagrams.aws.database import RDS
from diagrams.aws.network import ELB

with Diagram("Grouped Workers", show=False, direction="TB"):
    ELB("lb") >> [EC2("worker1"),
                  EC2("worker2"),
                  EC2("worker3"),
                  EC2("worker4"),
                  EC2("worker5")] >> RDS("events")
with control statement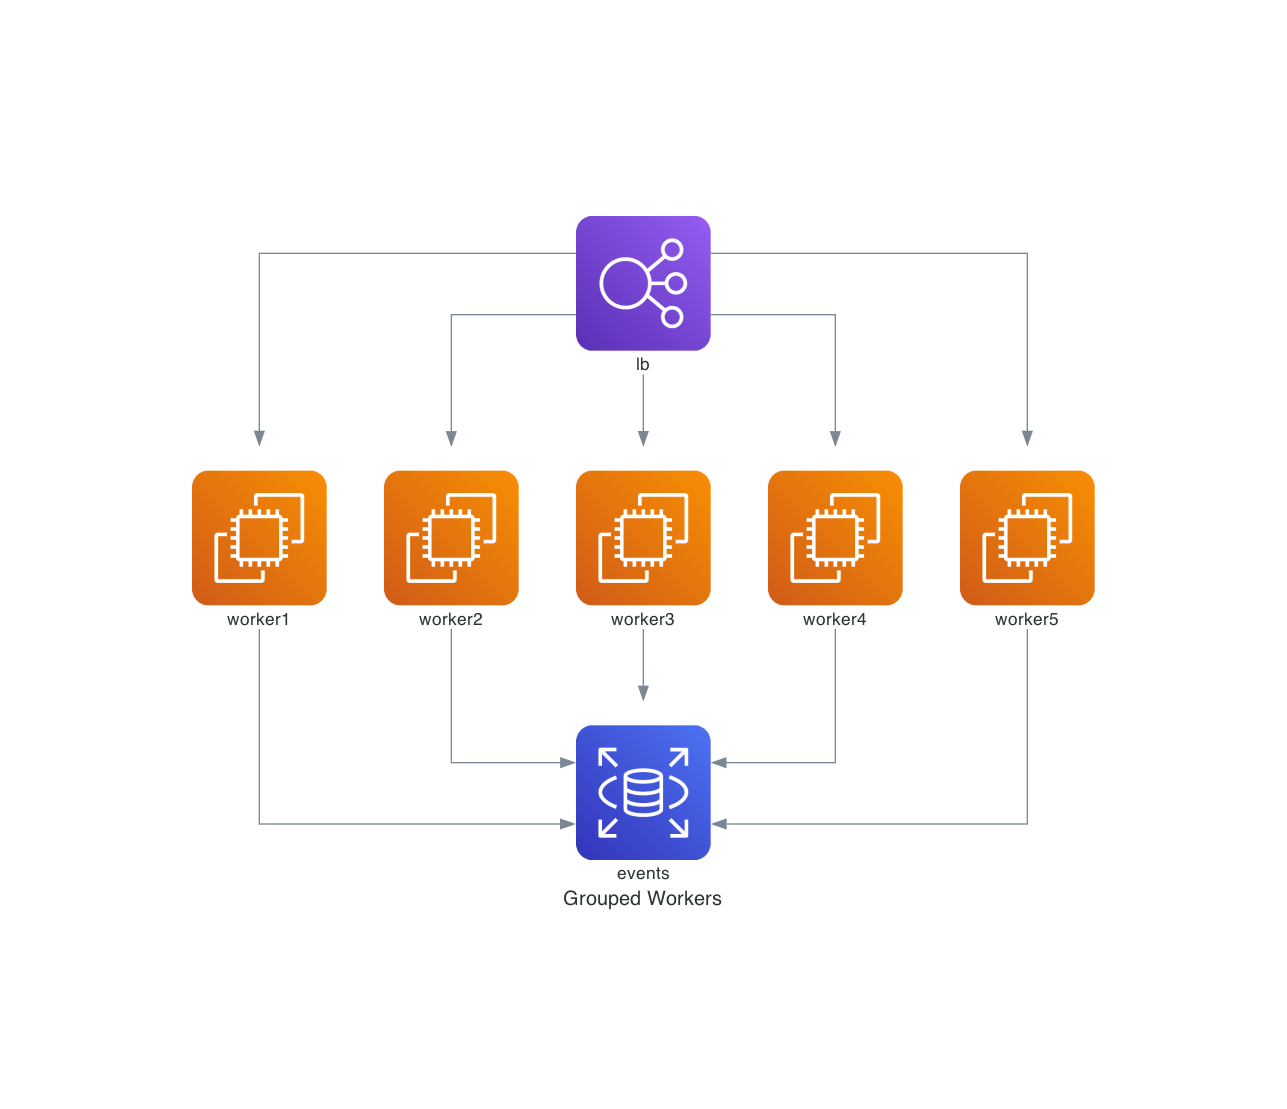
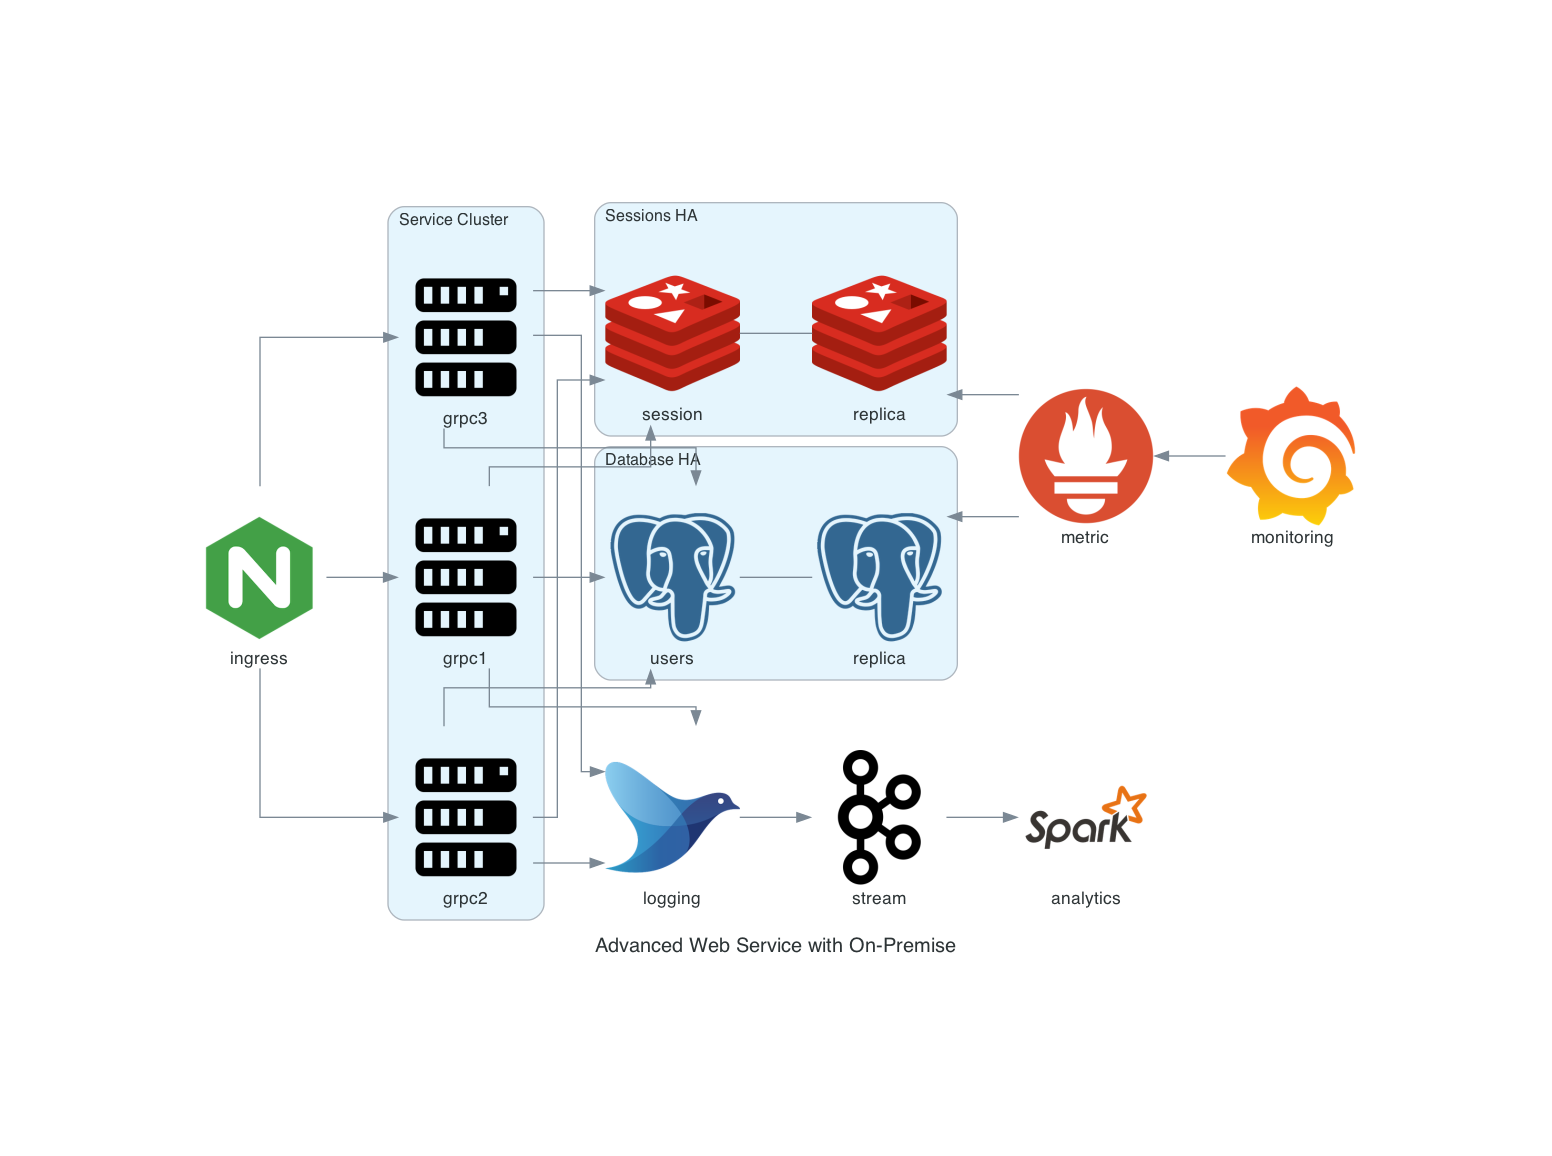
A more advanced example
from diagrams import Cluster, Diagram
from diagrams.onprem.analytics import Spark
from diagrams.onprem.compute import Server
from diagrams.onprem.database import PostgreSQL
from diagrams.onprem.inmemory import Redis
from diagrams.onprem.aggregator import Fluentd
from diagrams.onprem.monitoring import Grafana, Prometheus
from diagrams.onprem.network import Nginx
from diagrams.onprem.queue import Kafka

with Diagram("Advanced Web Service with On-Premise", show=False):
    ingress = Nginx("ingress")

    metrics = Prometheus("metric")
    metrics << Grafana("monitoring")

    with Cluster("Service Cluster"):
        grpcsvc = [
            Server("grpc1"),
            Server("grpc2"),
            Server("grpc3")]

    with Cluster("Sessions HA"):
        primary = Redis("session")
        primary - Redis("replica") << metrics
        grpcsvc >> primary

    with Cluster("Database HA"):
        primary = PostgreSQL("users")
        primary - PostgreSQL("replica") << metrics
        grpcsvc >> primary

    aggregator = Fluentd("logging")
    aggregator >> Kafka("stream") >> Spark("analytics")

    ingress >> grpcsvc >> aggregator
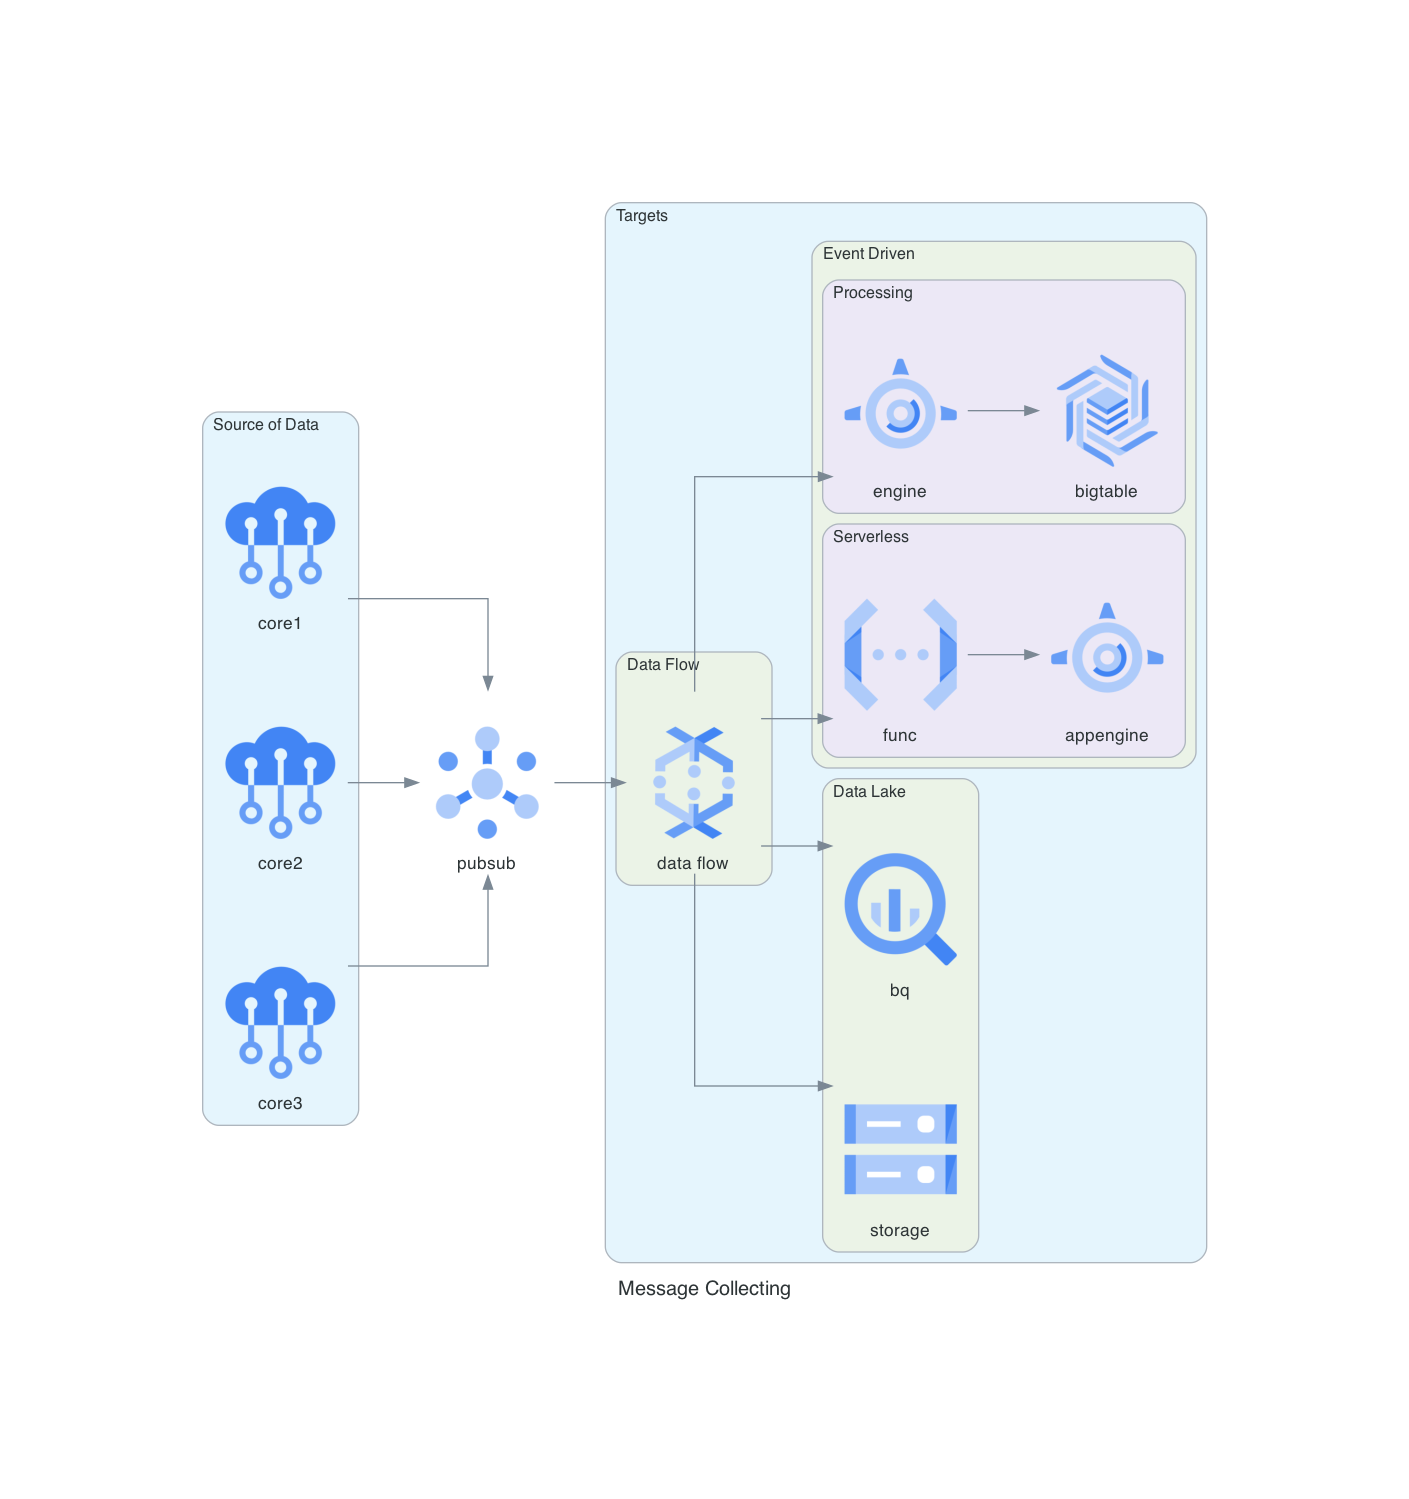
Working with GCP
from diagrams import Cluster, Diagram
from diagrams.gcp.analytics import BigQuery, Dataflow, PubSub
from diagrams.gcp.compute import AppEngine, Functions
from diagrams.gcp.database import BigTable
from diagrams.gcp.iot import IotCore
from diagrams.gcp.storage import GCS

with Diagram("Message Collecting", show=False):
    pubsub = PubSub("pubsub")

    with Cluster("Source of Data"):
        [IotCore("core1"),
         IotCore("core2"),
         IotCore("core3")] >> pubsub

    with Cluster("Targets"):
        with Cluster("Data Flow"):
            flow = Dataflow("data flow")

        with Cluster("Data Lake"):
            flow >> [BigQuery("bq"),
                     GCS("storage")]

        with Cluster("Event Driven"):
            with Cluster("Processing"):
                flow >> AppEngine("engine") >> BigTable("bigtable")

            with Cluster("Serverless"):
                flow >> Functions("func") >> AppEngine("appengine")

    pubsub >> flow
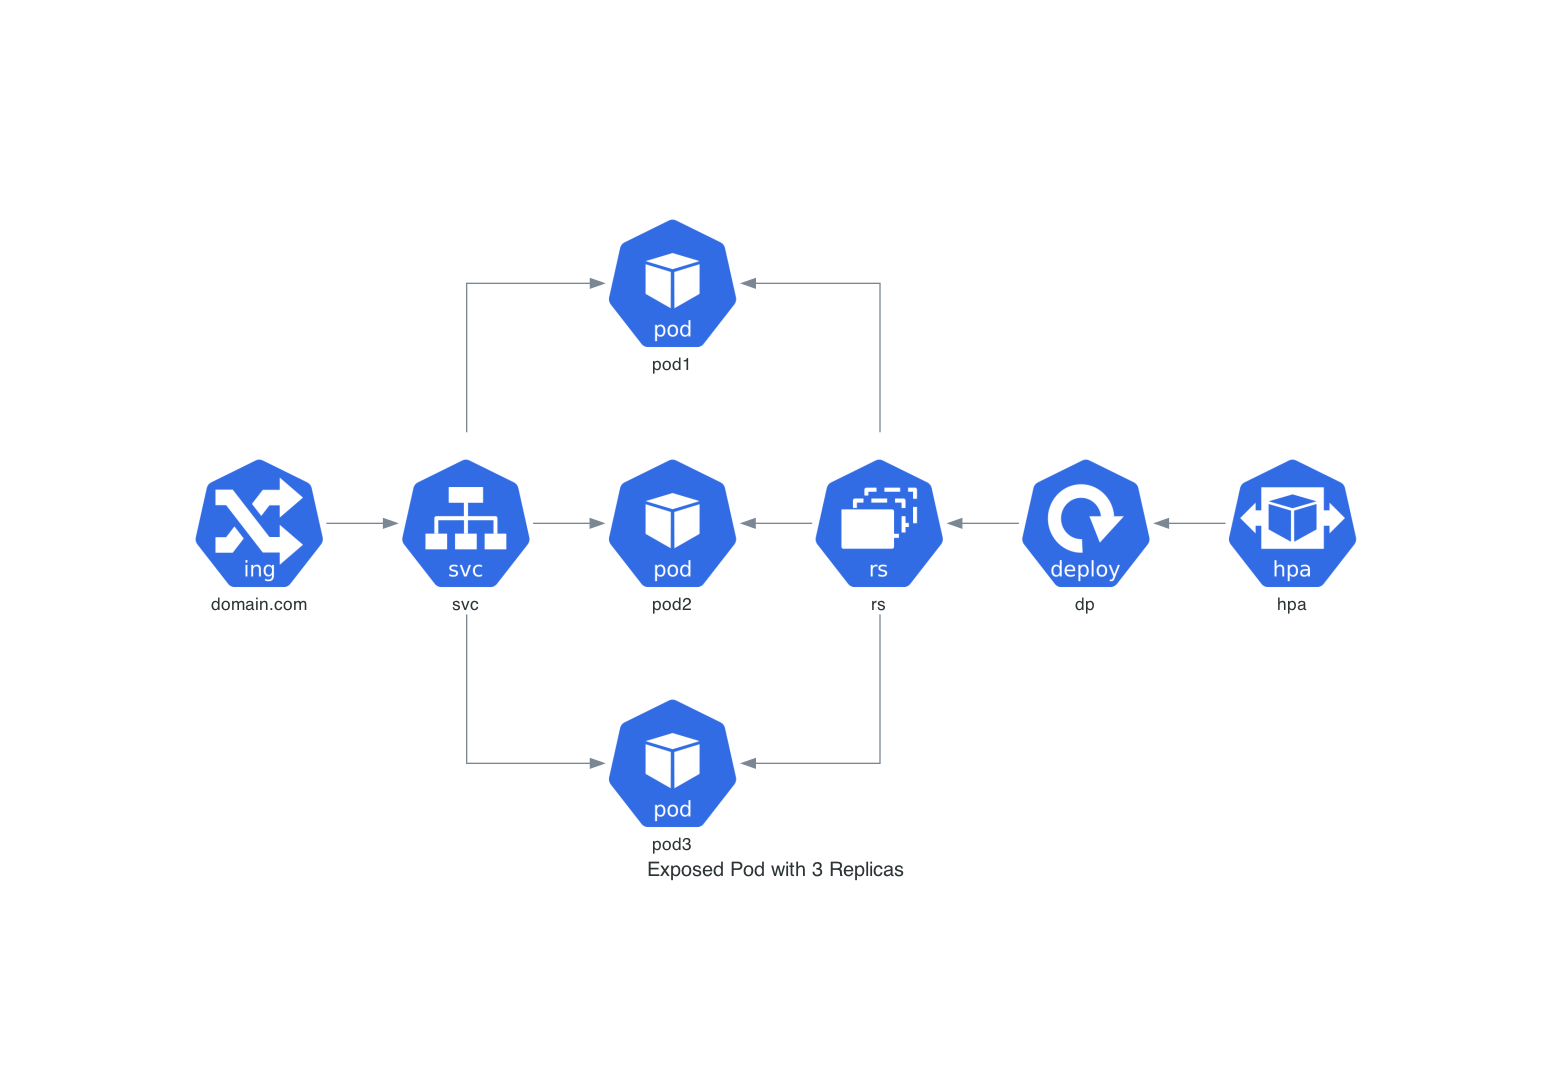
Kubernetes example
from diagrams import Diagram
from diagrams.k8s.clusterconfig import HPA
from diagrams.k8s.compute import Deployment, Pod, ReplicaSet
from diagrams.k8s.network import Ingress, Service

with Diagram("Exposed Pod with 3 Replicas", show=False):
    net = Ingress("domain.com") >> Service("svc")
    net >> [Pod("pod1"),
            Pod("pod2"),
            Pod("pod3")] << ReplicaSet("rs") << Deployment("dp") << HPA("hpa")
Official Documentation
Tutorials and Online Resources
https://diagrams.mingrammer.com/docs/getting-started/examples